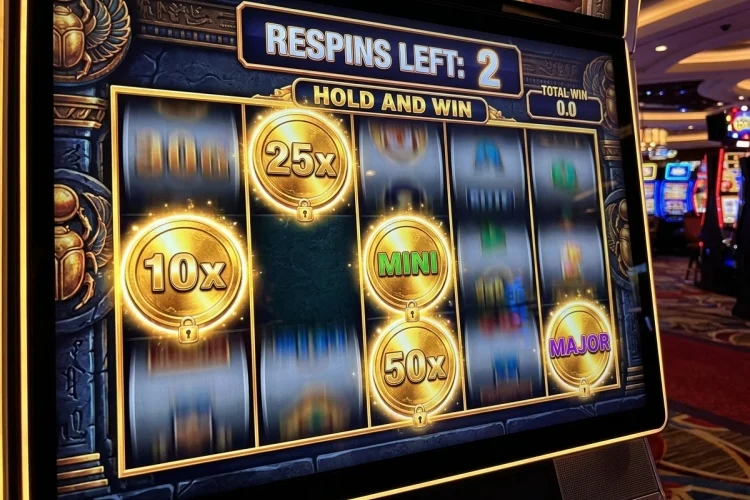

Imagine opening two slots that both advertise 96% RTP. You play the first and see plenty of modest payouts. The second produces longer losing stretches, but its free spins can suddenly generate a huge multiplier. If the return percentage is identical, why do they feel so different?
The answer lies in the math model. What Is a Slot’s Math Model? It is the probability structure that decides how often different outcomes occur and how much they pay.
RTP is part of that design, but volatility, jackpots, feature frequency, hit rate, and payout distribution matter just as much.
A Math Model Is the Personality Behind the Slot
Artwork gives a slot its visual personality. The math model gives it its behavioural personality.
Developers decide how symbols are distributed, how combinations pay, when bonuses can trigger, how multipliers behave, and where the largest prizes sit in the probability curve.
All of those decisions interact.
GLI explains that game mathematics evaluation can measure RTP while separately identifying contributions from base-game play, features, and jackpots. It can also calculate volatility.
So describing a slot simply as “96% RTP” is like describing a car only by its fuel economy.
Useful information, yes. Complete information, no.
Two 96% Slots Can Be Built Completely Differently
Consider two fictional games.
Both have a 96% RTP.
Game A places most of its return in regular base-game payouts. You might frequently see modest 1x, 2x, 5x, or 10x results.
Game B directs more of its theoretical return into free spins containing rare multipliers. Normal gameplay feels quieter, but occasional bonus rounds can produce much larger outcomes.
Over enough mathematical trials, both games can target roughly the same theoretical return.
The UK Gambling Commission defines theoretical RTP as the game’s designed return percentage. It separately defines volatility as a measure linked to the spread and frequency of prizes.
That distinction explains why RTP alone cannot tell you whether a slot feels “generous.”
Volatility Shapes the Short-Term Experience
For most players, volatility is one of the most noticeable consequences of the math model.
High-volatility games generally have greater swings. Their payout structures may include relatively rare but very large prizes.
Lower-volatility designs usually deliver a larger proportion of their return through smaller and more frequent outcomes.
The Gambling Commission specifically notes that high-volatility games can contain very large but rare prizes, whereas low-volatility games tend to be more predictable and dominated by small, frequent ones.
This does not mean low volatility eliminates losses.
It simply changes how the game’s theoretical return is distributed.
A high-volatility 96% slot can therefore produce a dramatically harsher 100-spin session than a low-volatility game with the same RTP.
Feature Frequency Changes Where the Value Appears
Suppose a slot’s free spins contain enhanced wilds and a multiplier capable of reaching 500x.
That feature might contribute a meaningful portion of the game’s overall RTP.
If so, regular base-game rounds may need to return less value so that the complete model still stays at the chosen theoretical target.
This creates what players sometimes describe as a “bonus-dependent” game.
The bonus can feel extremely important because the mathematics genuinely allocates part of the payout expectation to that feature.
GLI’s testing framework explicitly recognizes RTP contributions from both base games and feature games.
The same principle applies to jackpots.
A game containing a jackpot contribution can have part of its return tied to an event that occurs very infrequently.
Jackpot Math Can Make a Game More Volatile
Progressive jackpots provide an extreme example of payout concentration.
The UK Gambling Commission defines a progressive jackpot as a prize that grows through contributions from money wagered within a game.
Because jackpots may be exceptionally large and infrequent, regulators treat their performance differently when monitoring RTP.
The Commission notes that progressive jackpots can carry very high volatility because they are rare and large, making conventional RTP measurement less practical in some circumstances. Frequency, distribution, and average jackpot levels may instead need to be examined.
For players, this means two games with similar headline RTP percentages can still contain very different amounts of jackpot exposure.
That changes the entire risk profile.
Hit Frequency Does Not Tell You How Much You Will Win
A math model also determines how often paying combinations occur.
This is commonly described as hit frequency.
Imagine Game A has a 35% hit rate while Game B has 20%.
It might seem obvious that Game A is better, but that conclusion would be too simple.
Many of Game A’s wins could be smaller than the original bet. Game B could pay less frequently while producing larger average winning amounts.
For example, a $1 spin paying $0.40 is still a payout even though your net result is a $0.60 loss.
Hit frequency therefore describes one dimension of the model, while average win size describes another.
The designer has to balance both against the target RTP and overall volatility.
This is why statistics need to be interpreted together rather than in seperate isolation.
Reel Weighting Helps Create Those Differences
Behind the visual symbols is a probability distribution.
High-value symbols can be assigned lower mathematical frequecy than cheaper symbols. Bonus symbols may have their own weighting, and their distribution can differ from reel to reel.
The RNG produces random output, while mapping converts that output into game outcomes such as reel-strip symbols.
Imagine a premium symbol effectively appears on 3% of possible positions while a low-paying symbol represents 20%.
The low-value combination naturally becomes easier to form.
Developers can adjust these probabilities together with payout values until the overall model achieves the desired RTP, volatility, and feature behaviour.
This balancing process can become especially complex when wilds substitute for multiple symbols or cascading wins create additional outcomes without another paid spin.
Multipliers Can Transform the Risk Profile
Multiplier mechanics are another major part of modern slot mathematics.
A simple slot may use a fixed 2x wild.
A more volatile design could offer multiplier values ranging from 2x to several hundred times the win, with the largest values appearing extremely rarely.
Both systems influence expected payouts.
Suppose a huge 500x multiplier exists but carries very low probablity. That rare event may still consume a meaningful portion of the game’s theoretical RTP because of its enormous value when it occurs.
Mathematically, probability and payout size are always connected.
Rare events can support larger prizes, while frequent outcomes generally need smaller values if the overall RTP is to stay at the same target.
That trade-off is central to slot design.
Maximum Win Is Not a Complete Measure of the Model
A 50,000x maximum win sounds more exciting than 1,000x.
It does not automatically tell you which game has better mathematics from the player’s perspective.
The 50,000x event might be extraordinarily rare.
Another slot with a smaller top prize could distribute significantly more value through ordinary outcomes.
Maximum win tells you the ceiling. RTP describes long-run theoretical return. Volatility describes dispersion. Hit frequency describes payout occurrence.
The math model connects all four.
Looking at just one statistic can therefore create a misleading impression of how the game actually behaves.
RNG and Math Model Are Not the Same Thing
The Random Number Generator is often described as if it is the mathematics of the slot.
It is better to think of the two as separate but connected components.
The RNG generates random numbers with the intended property of statistical randomness. Mapping then connects those values with game outcomes.
The math model determines the probability structure and payout consequences of those outcomes.
Testing procedures reflect this distinction. UK regulatory testing can separately examine RNG implementation, raw output, game design, theoretical RTP, rules, mathematics, and the mapping process.
So randomness determines which valid result occurs.
The math model determines what the collection of valid results looks like in the first place.
Why Actual RTP Can Drift in Short Samples
If the math model targets 96%, why might a live game record 92% or 101% for a period?
Variance.
The UK Gambling Commission gives an example of a game designed at 91.68% RTP. Even after 400,000 plays, an actual return between approximately 89.93% and 93.43% could still fall within the example’s expected statistical tolerance.
As the sample grows, the acceptable range becomes tighter.
This is important for understanding slot mathematics because the theoretical model describes long-run behaviour, not a promise about a particular player’s evening.
Short sessions can be wildly different from the designed average without showing that anything is wrong with the game.
Why Math Models Are Independently Tested
In regulated environments, developers cannot simply publish whatever theoretical numbers they want without scrutiny.
UK testing procedures include verification of the game’s mathematics and theoretical RTP, software implementation, RNG behaviour, game rules, and simulated actual return.
GLI likewise describes mathematical analysis in which specialists evaluate pay combinations or build simulators to handle extremely large numbers of possible outcomes.
The purpose is to check that the finished product behaves according to its approved design.
That does not remove the house edge or guarantee a particular player result.
It simply means the math should match the stated rules and specifications.
What Is a Slot’s Math Model? It is the hidden structure determining how RTP is divided among ordinary wins, bonuses, multipliers, jackpots, and rare maximum payouts.
That is why two slots with the same RTP can feel completely different. Before comparing games, look beyond one percentage and check volatility, payout structure, bonus rules, and maximum win.
Together, those details provide a much clearer picture of the game’s actual design.